Salesperson and team reports
See who sells what and how productive each person is: quotes sent and won, win rate, visits done, hours, and revenue per hour.
Included on the Pro plan and up. Compare plans New and rolling out: if you don’t see it yet, ask us to switch it on.
The Team view on Reports gives one row per person for the date range you pick: their sales on the left, their field work on the right.
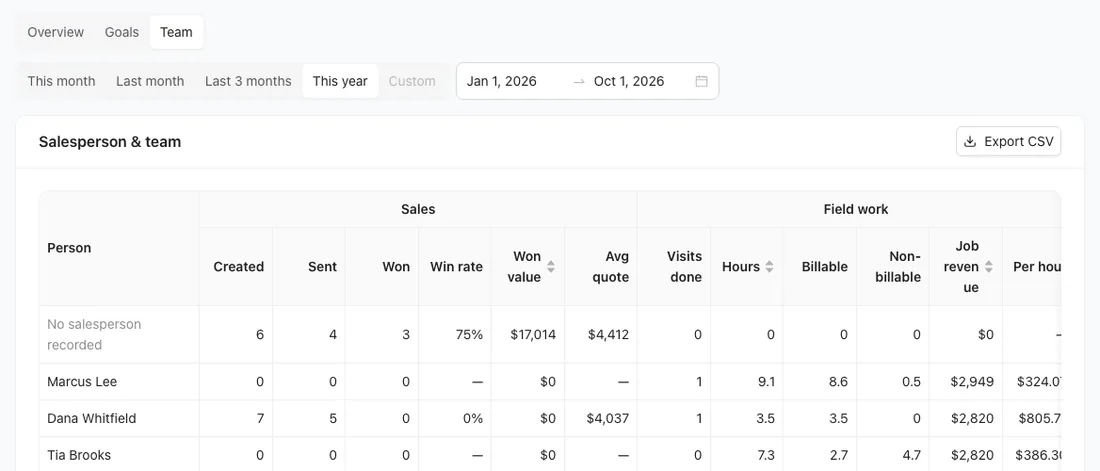
Open it
- Click Reports in the menu.
- Click Team at the top.
- Pick a date range: This month, Last month, Last 3 months, This year, or your own dates.
You need a role that can see prices and money.
What each column means
Sales (the salesperson is whoever created the quote):
| Column | Counts |
|---|---|
| Created | Their quotes created in the range. |
| Sent | Their quotes sent in the range. |
| Won and Won value | Their quotes signed in the range, and what they're worth. |
| Win rate | Of their quotes sent in the range, the share signed so far. |
| Avg quote | The average total of their quotes sent in the range. |
Field work:
| Column | Counts |
|---|---|
| Visits done | Visits completed in the range that they were assigned to. |
| Hours | Time they clocked that started in the range, without breaks. |
| Billable / Non-billable | Time on a job, and travel or shop time. |
| Job revenue | The totals of jobs completed in the range that they worked on (assigned to a visit, or clocked time on). A job two people worked counts in full for each. |
| Per hour | Job revenue divided by hours clocked. |
Click How these are counted under the table for the same explanations.
Quotes made before salespeople were tracked, or imported from another system, show on a row called No salesperson recorded.
Export it
Click Export CSV to download the table, for example to work out commissions in a spreadsheet.